Using Grafana alerts
After setting up solana-exporter to monitor a stakepool, it may be useful to set up Grafana alerts to notify relevant
operators of critical changes, and even automatically act to fix potential issues.
This example uses the new Grafana 8 Alerts.
Creating an alert
For extra documentation on how to create and manage Grafana alerts, refer to the official documentation.
Node delinquency
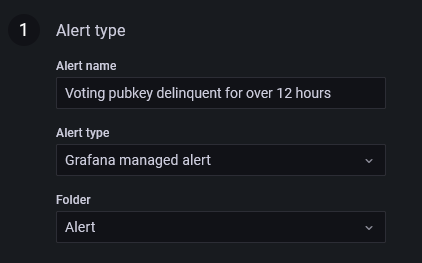
In this example, we will make an alert that fires if a voting pubkey becomes delinquent for over 12 consecutive hours.
-
Create a Grafana managed alerting rule. Give it an appropriate name and place it in a folder.
-
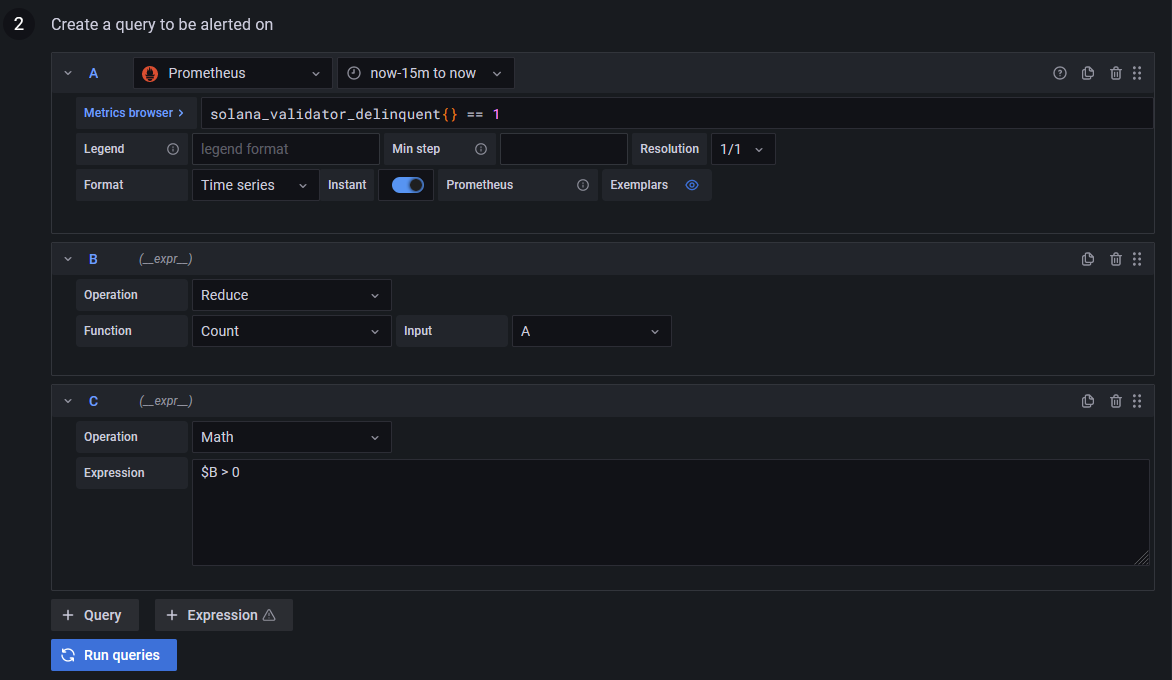
Set up the query to be alerted on. You need three queries:
- Prometheus (A) -
solana_validator_delinquent{} == 1. This filters for all delinquent (1) nodes. Select an appropriate time-range. For example, a "now-15m to now" time range means that, when evaluating, the alert system treats any duration of delinquency during the last 15 minutes as delinquency. - Expression (B) - Reduce (A) by using the Count function. This counts how many delinquent nodes there are.
- Expression (C) - Use the Math expression
$B > 0. This expression will be used to fire an alert.
- Prometheus (A) -
-
Define the alert condition to use (C) and evaluate every
1mfor12h. This instructs Grafana to check for delinquency every minute, and firing an alert if a node is delinquent for more than 12 hours. Set the "Alert state if no data or all values are null" to be "OK", as the Prometheus query returns nothing if all nodes are active. Finally, choose if you wish timeouts or query errors to fire an alert.
To test this alert, invert the query (A) with solana_validator_delinquent{} == 0 and temporarily reduce the firing
threshold from 12h to a more responsive value. Within a few minutes, an alert should be fired.
Receiving alert notifications
See Grafana contact points on the multitude of ways of receiving Grafana alerts.