Setting up Grafana
After solana-exporter exports gauges and metrics to Prometheus, it may be useful to visualise these metrics.
Grafana allows you to create custom dashboards using Prometheus as a data source.
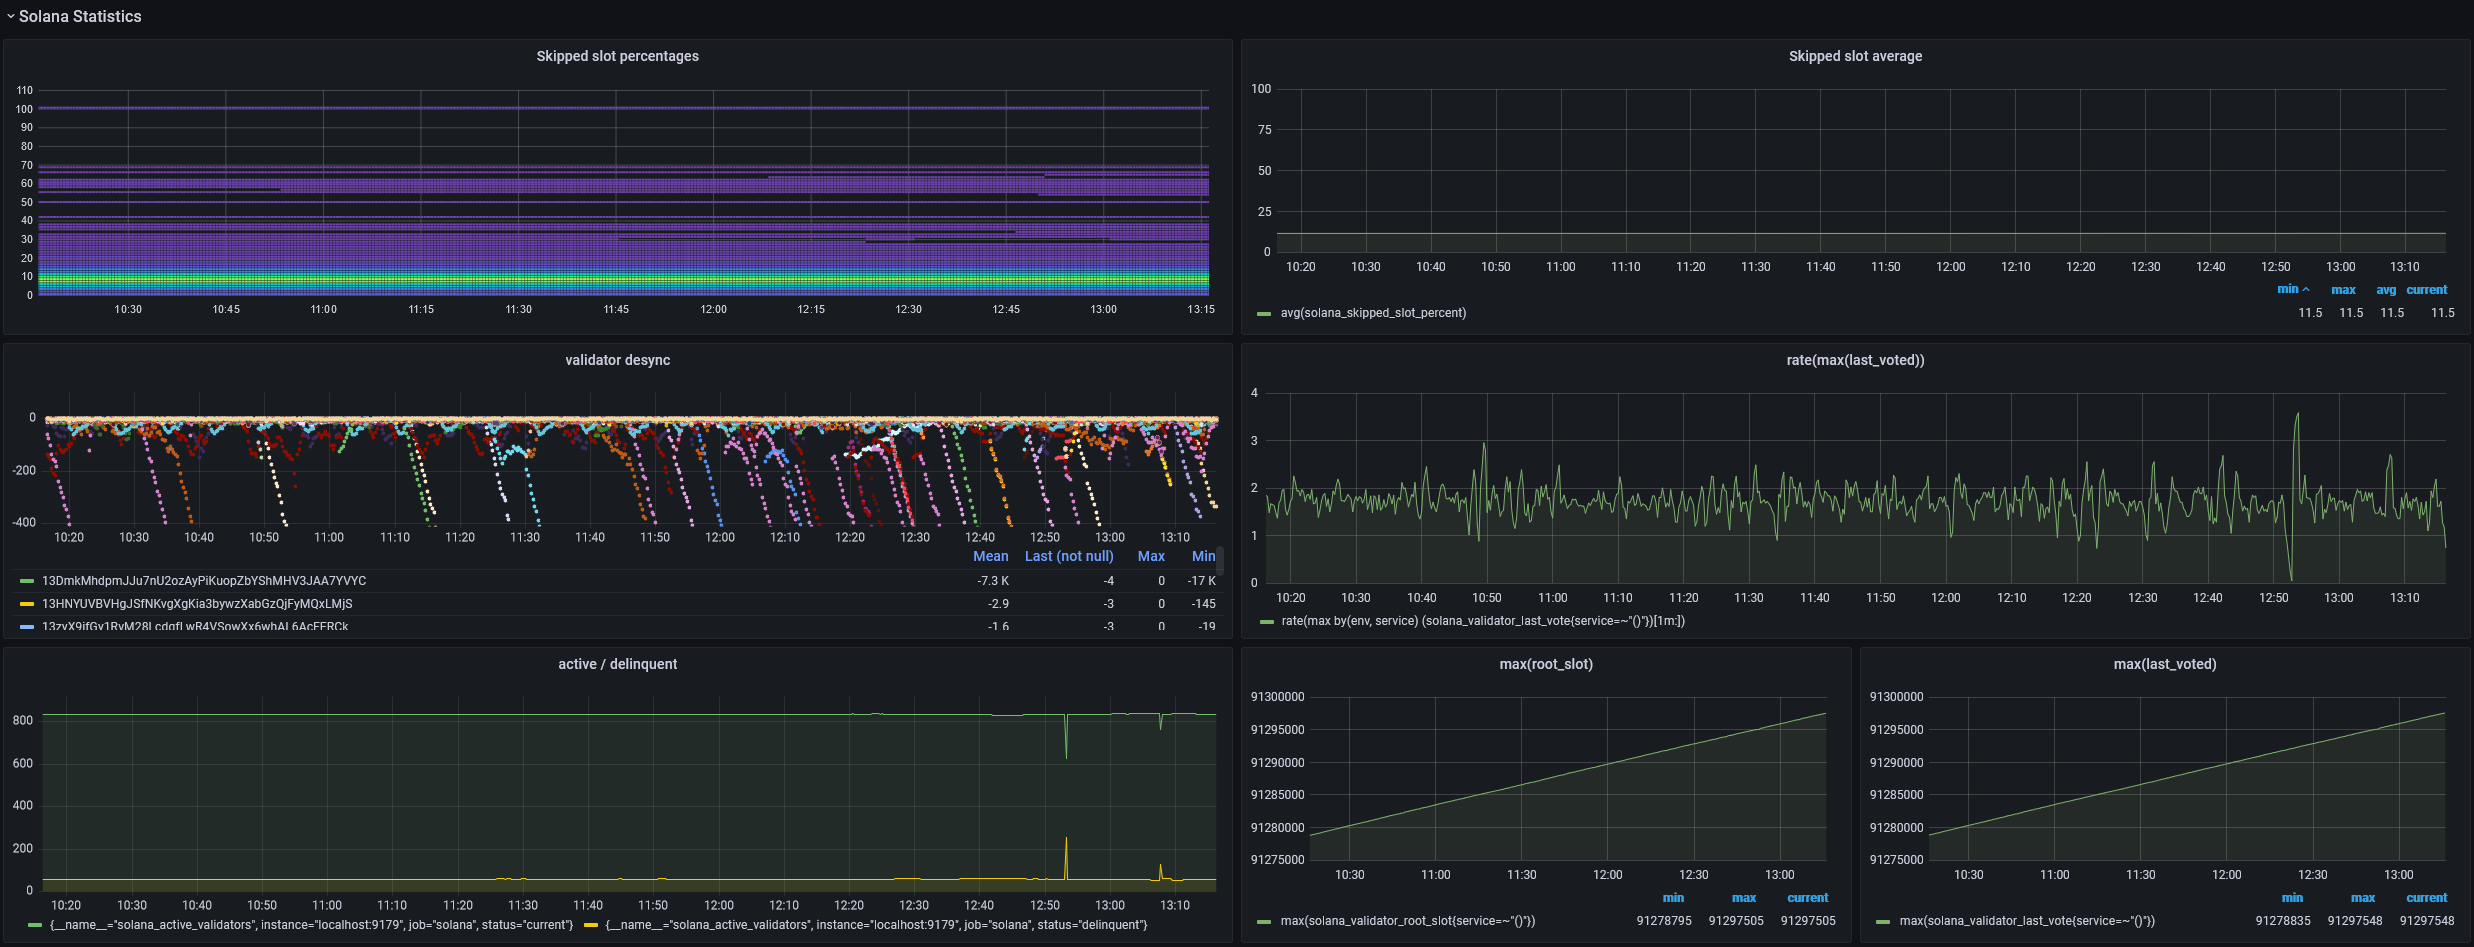
The repository includes a basic dashboard (rustiq.json) that shows off a range of gauges that solana-exporter
can export using graphs. Some included visualisations include the monitoring of basic cluster statistics such as
transactions per second, skipped slots percentage. Decentralisation metrics such as the distribution of staked SOL
across datacenters can also be tracked (MaxMind account required).
To use the provided dashboard, first add the Prometheus data source. Then, import the dashboard.
For an in-depth explanation of each exported gauge, see then next chapter.
Sample screenshots
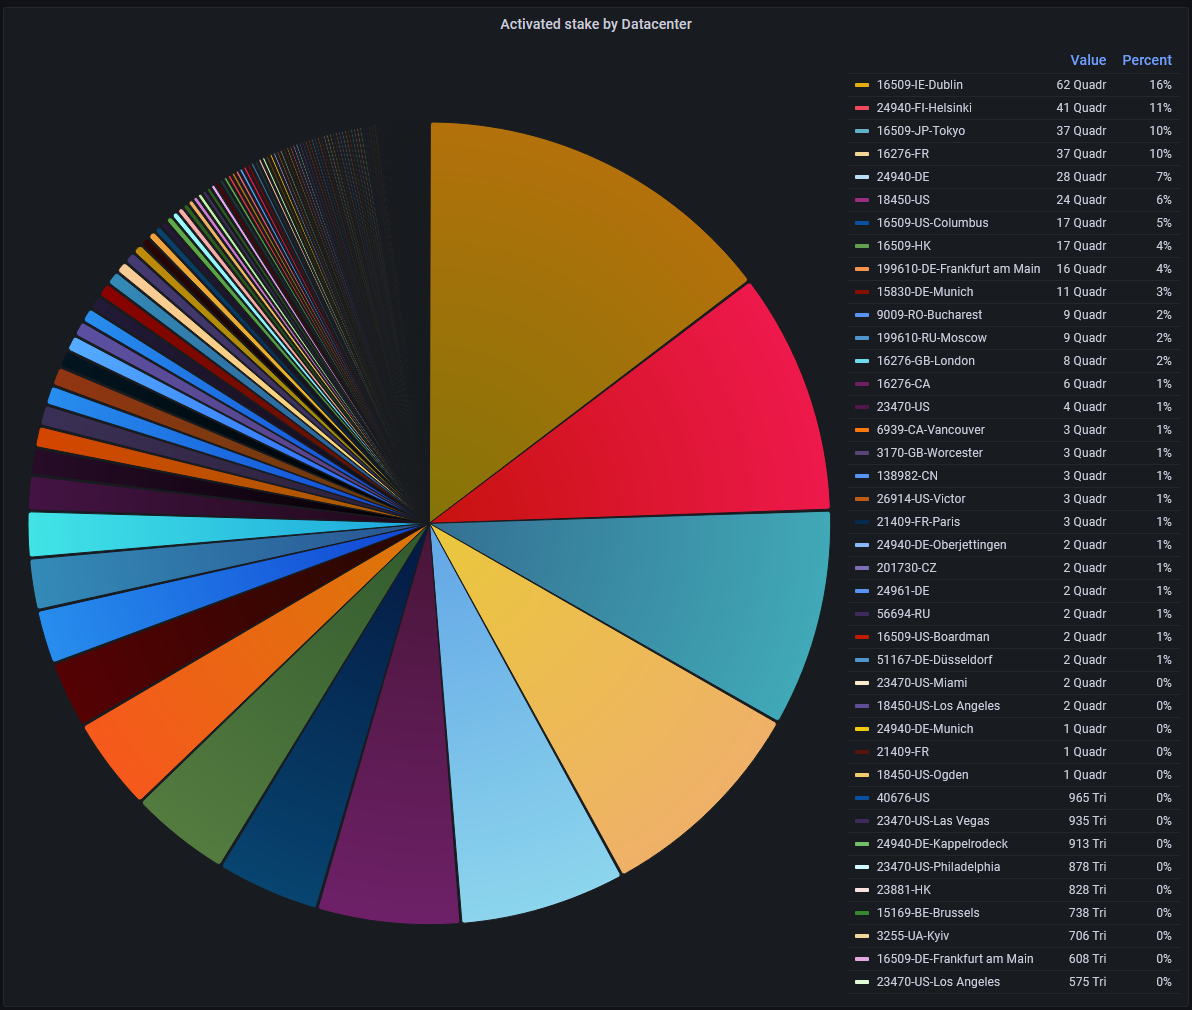 Pie chart of activated stake by datacenter
(Gauge used:
Pie chart of activated stake by datacenter
(Gauge used: solana_active_validators_dc_stake)
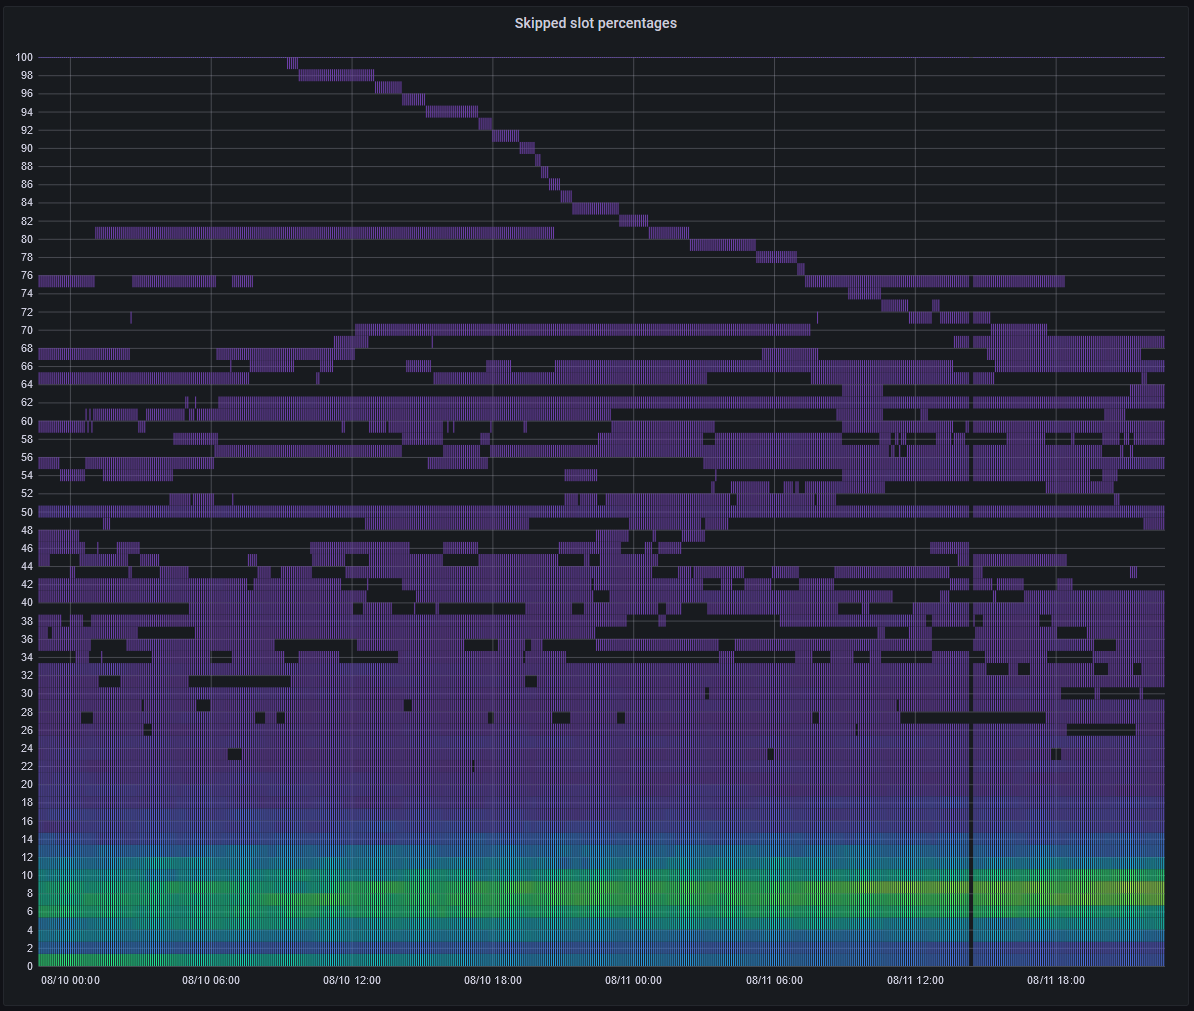 Heatmap of average skipped slot of validators
(Gauge used:
Heatmap of average skipped slot of validators
(Gauge used: solana_skipped_slot_percent)
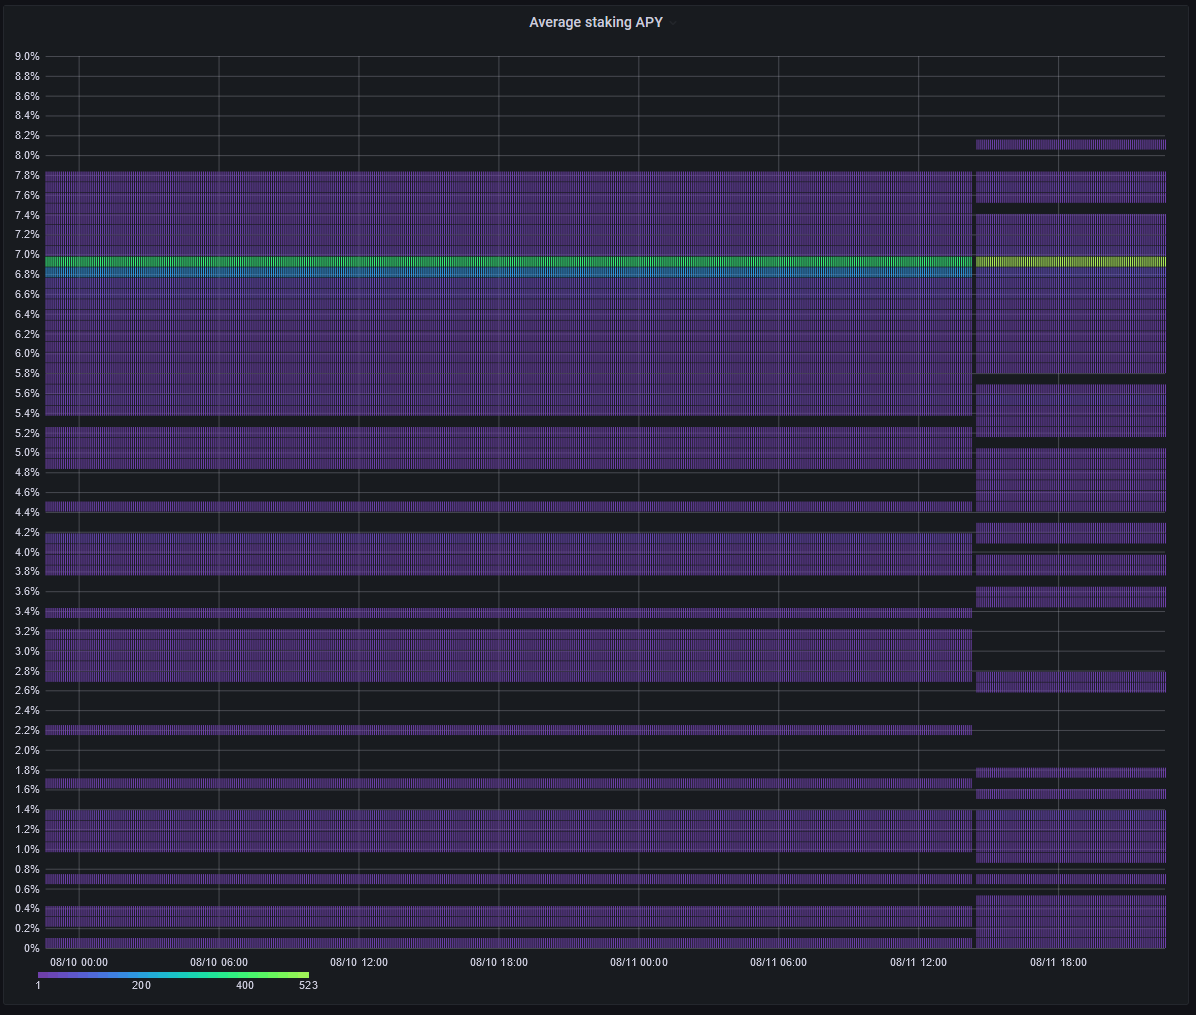 Heatmap of average staking APY over 5 epochs
(Gauge used:
Heatmap of average staking APY over 5 epochs
(Gauge used: solana_average_staking_apy)